Demographic Dynamics, Density Thresholds, and Unit Economics: A Market Study on Orlando’s Specialty Coffee Ecosystem
Evaluating urban beverage markets requires separating permanent residential demand from transient consumer volume. While tourism provides short-term cash flow, recurring daily consumption by local residents forms the economic foundation needed to cover fixed operational overhead. In Orlando, Florida, a rapidly expanding residential core paired with nation-leading café density creates a high-stakes market where operational strategy dictates commercial survival.
Beyond the headlines of endless Sunshine State growth lies a complex operational reality. For years, investors viewed Central Florida through a single lens: a hospitality enclave where vacation spending drowned out local business dynamics. Today, that framework is obsolete. Orlando’s demographic compounding has created a mature, hyper-caffeinated urban center where consumer expectations are high and retail real estate is fiercely contested. Understanding this market requires analyzing both the macro population drivers and the micro unit economics that determine shop-level profitability.
1. Demographic Engine & Residential Baseline
Introductory Overview:
To understand the baseline volume capacity of Orlando’s specialty coffee market, operators must look past seasonal tourist influxes and focus on the permanent local base. A expanding resident population creates a recurring customer pipeline that drives morning rush-hour velocity from Monday through Thursday. This steady traffic is essential for shielding retail storefronts during off-peak travel months and establishing high lifetime customer value (LTV).
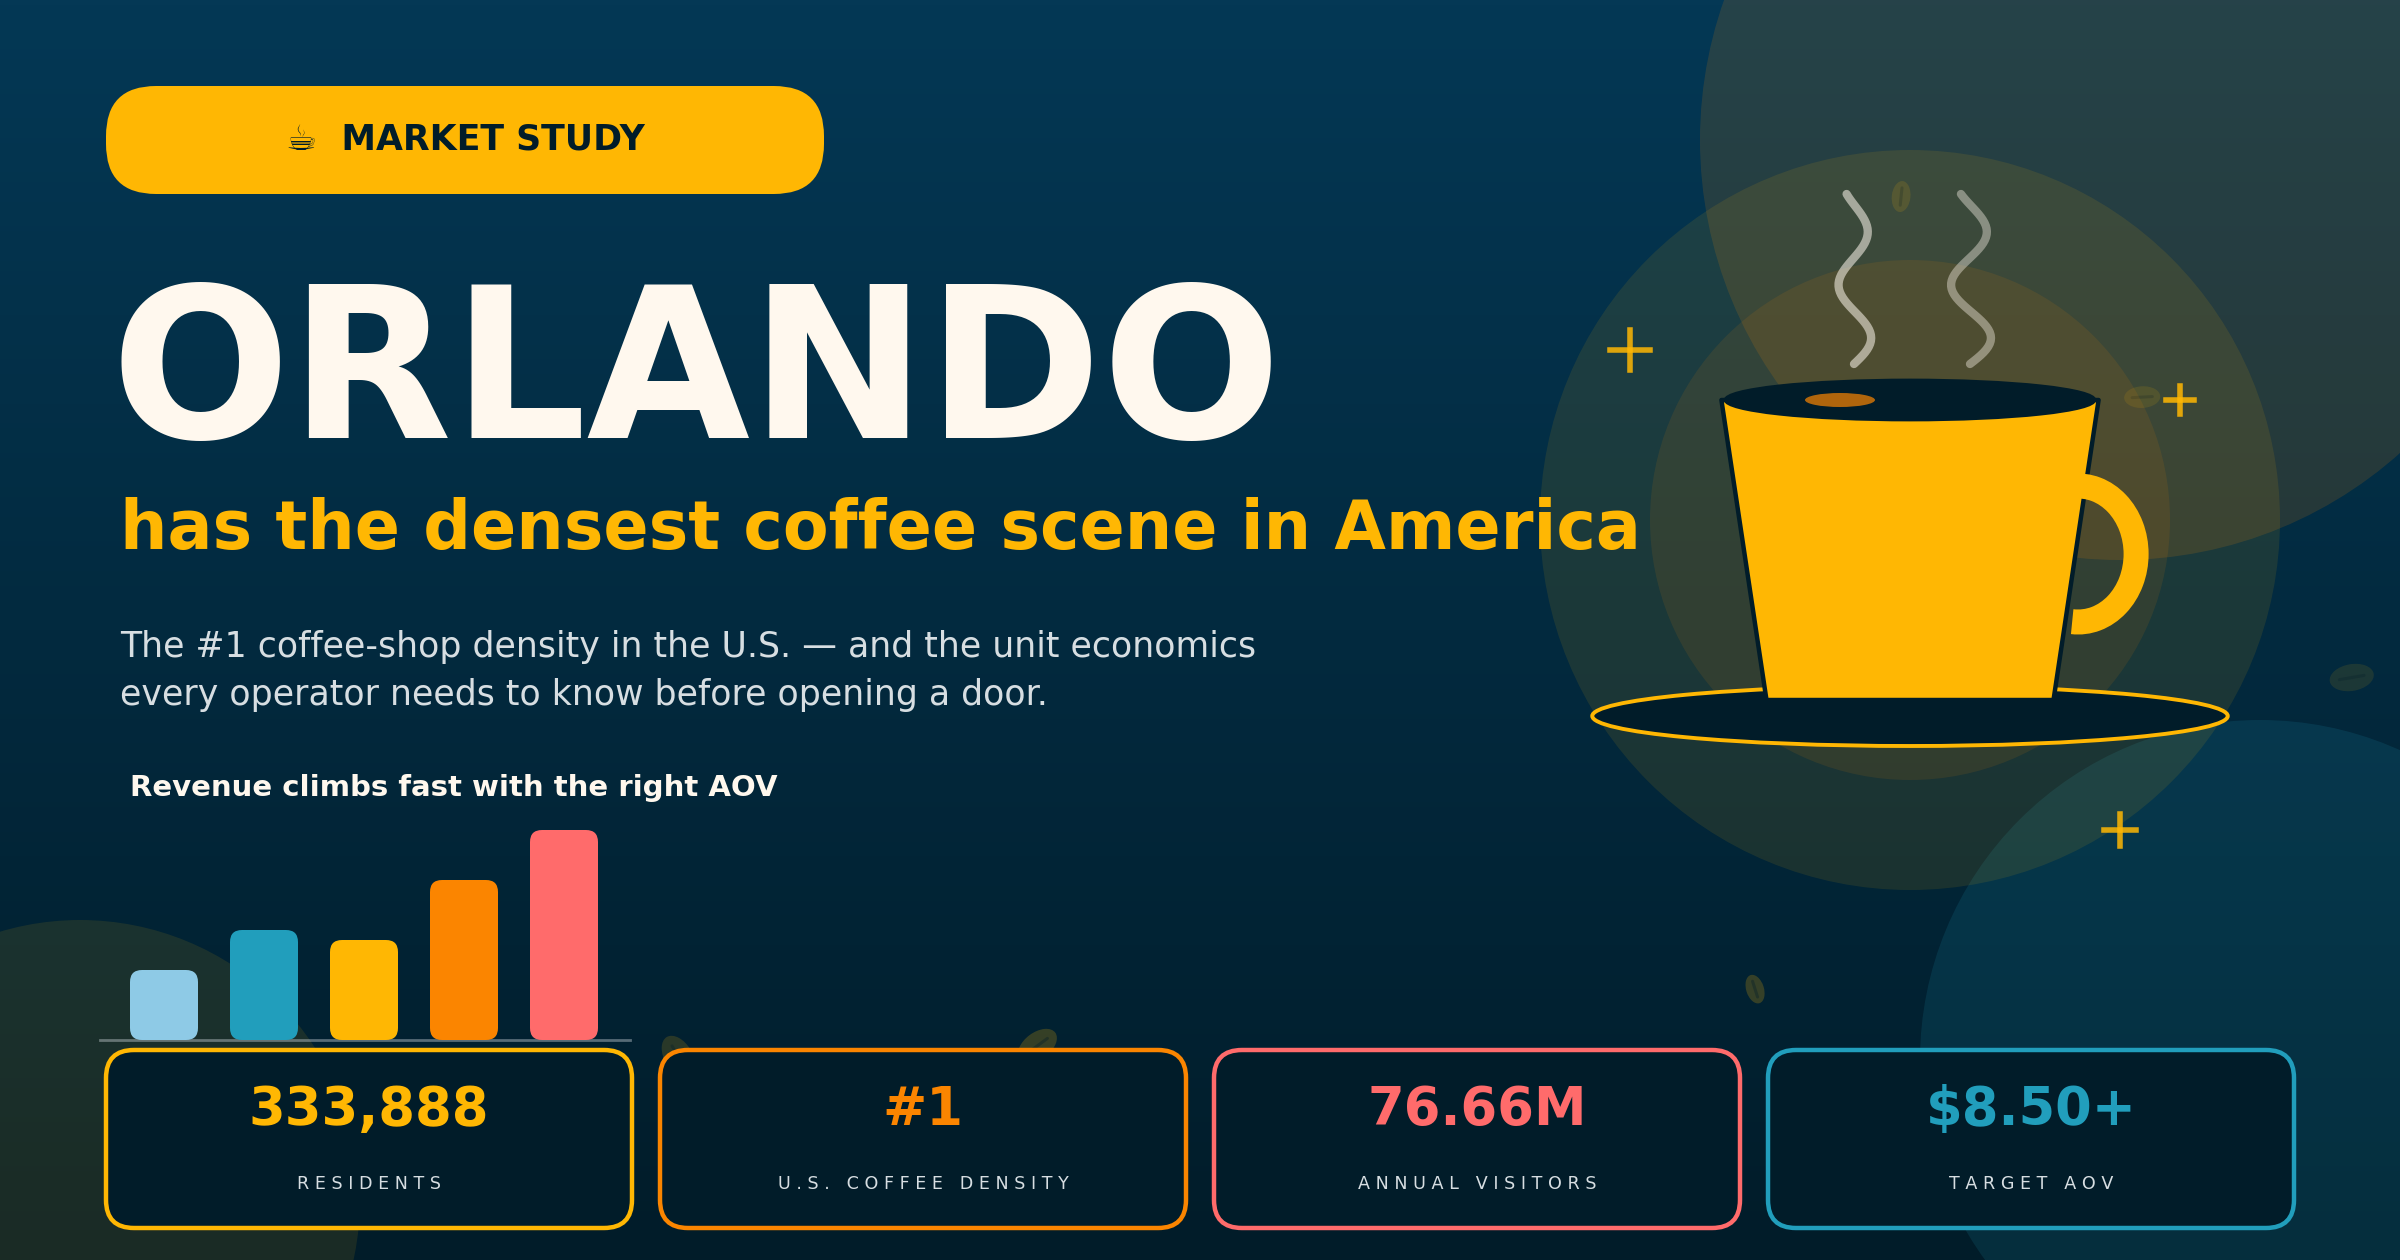
Permanent Residential Base: City population reached an estimated 333,888 residents as of mid-2025.
5-Year Growth Trajectory: Expanded by 8.4% compared to the 307,573 residents recorded in the 2020 U.S. Census.
Long-Term Urban Compounding: Represents a dramatic expansion from the 238,300 residents recorded in 2010.
Annual Tourist Multiplier: Complemented by a record-setting 76.66 million total visitors in 2025 (up 1.8% year-over-year).
Domestic Travel Base: Supported by 70.33 million domestic visitors who drive reliable weekend demand spikes.
International Travel Share: Fueled by 6.34 million overseas visitors characterized by longer stays and higher per-trip spending.
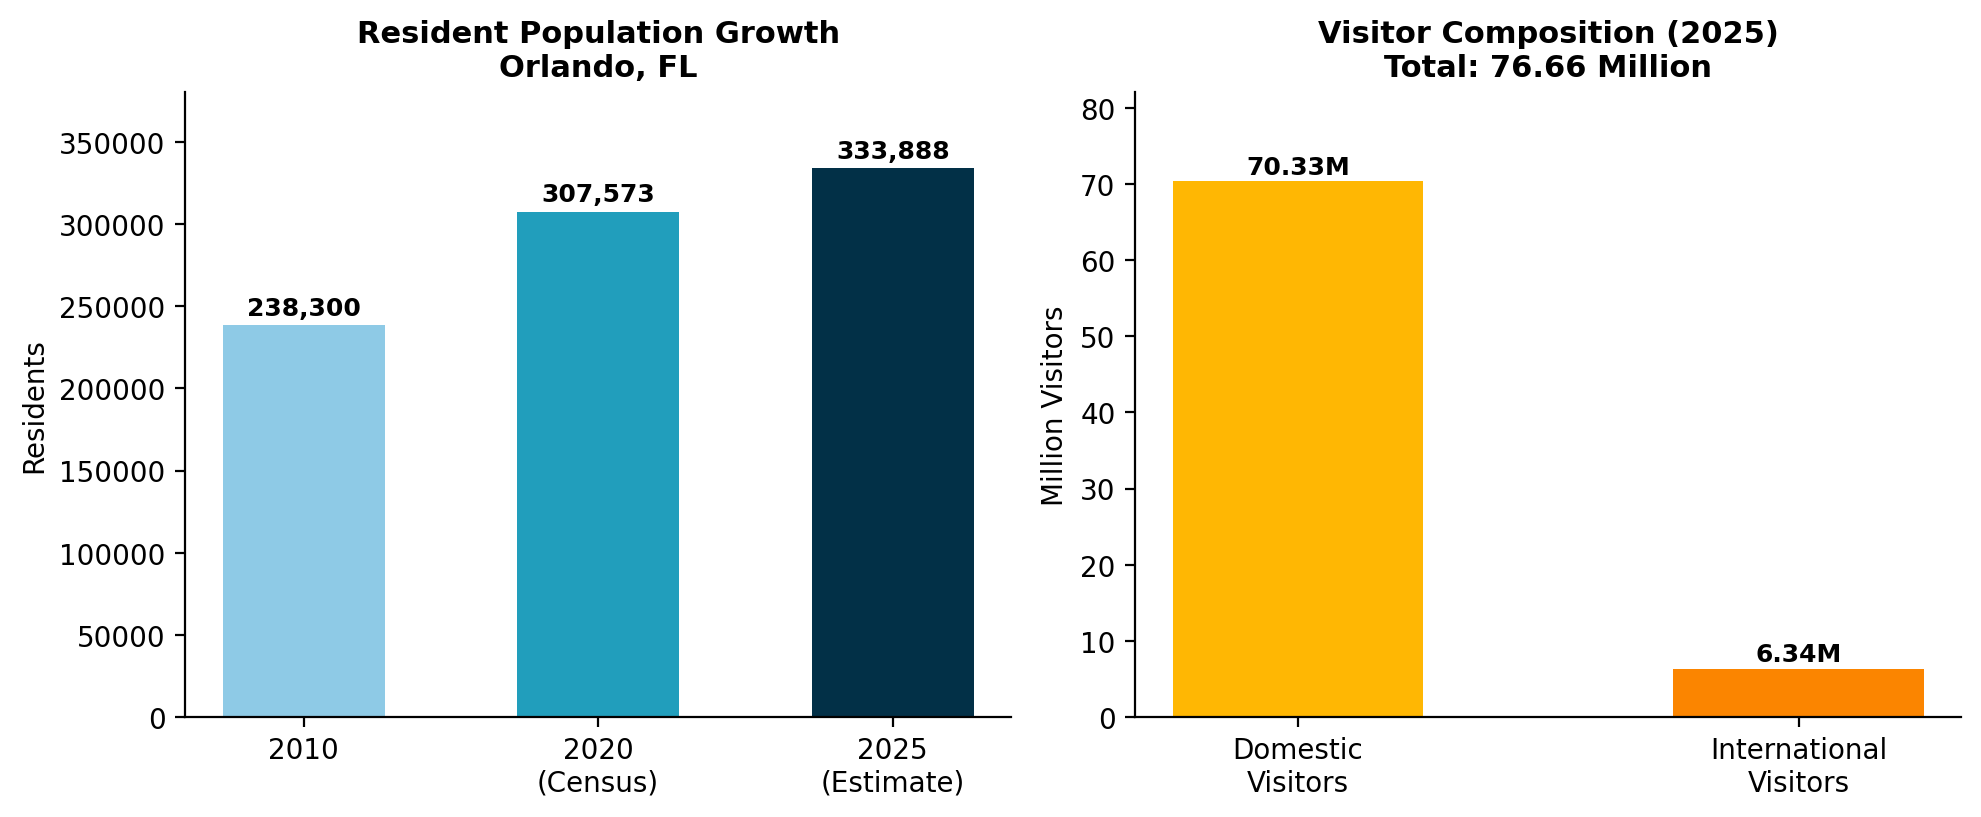
Market Interpretation: Residential growth builds predictable Monday-to-Thursday sales routines. Remote workers, local medical professionals, and daily commuters create stable lifetime customer value (LTV) that shields operators from off-peak tourism seasonality. While tourists bring high-margin liquidity on weekends, it is the local neighborhood regular who pays the base rent month after month.
2. Supply-Side Density & Market Maturity
Introductory Overview:
Orlando has quietly evolved from a commodity, fast-food coffee market into one of North America's premier specialty beverage capitals. The presence of roughly 50 local roasters and nearly 200 independent shops has educated the local palate, raising consumer standards across roasting profiles, origin sourcing, and precision extraction. However, this infrastructure maturation also introduces immense competitive pressure for new market entrants.
#1 National Density Ranking: Ranked first in the U.S. for per-capita density of coffee shops, coffee houses, and cafés in a WalletHub analysis.
#4 Overall Coffee City: Positioned fourth nationwide, trailing only historical coffee hubs like San Francisco, Portland, and Seattle.
Density Index Benchmark: Holds a coffee shop density index of 0.4571 per population unit, the highest in comparative municipal datasets.
Independent Storefront Footprint: Sustains approximately 192 active independent coffee shops across commercial corridors.
Local Supply Chain Depth: Houses roughly 50 active local roasters, keeping green-bean roasting and wholesale margins in-region.
Top Consumer Satisfaction Ratings: Leading independent brands maintain elite customer ratings, including Haan Coffee (4.8/5), Craft & Common (4.7/5), and Stemma Craft Coffee (4.7/5). (Ratings @ 29 August 2026)
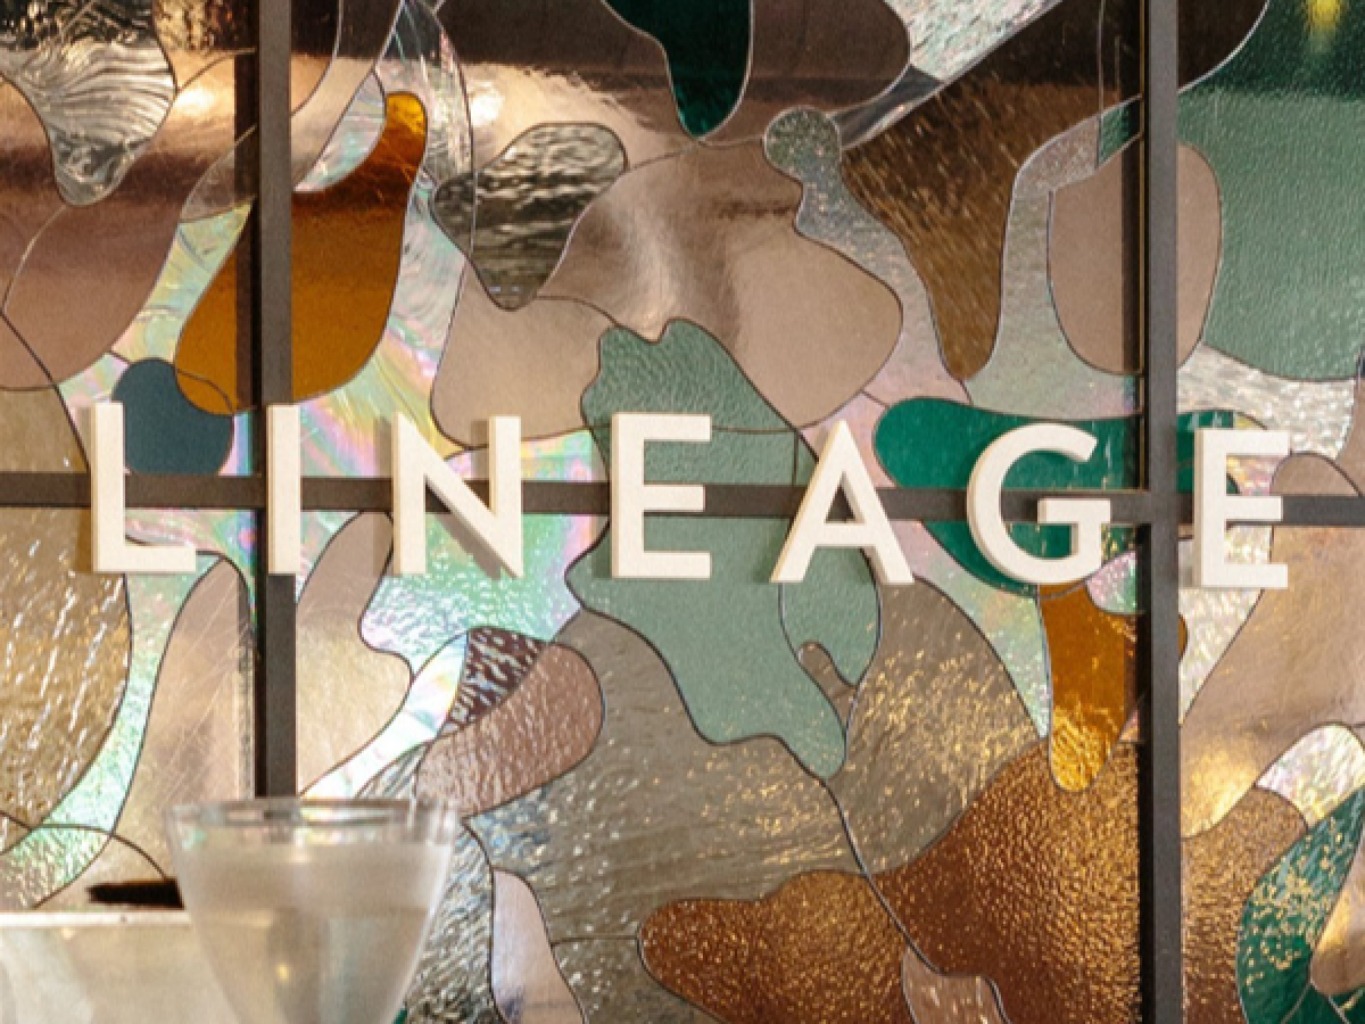
Established Brand Lineup: Prominent operators like Lineage Coffee Roasting, Deeply Coffee Company, Lobos Coffee Roasters, and Qreate Coffee + Studio set high product standards.
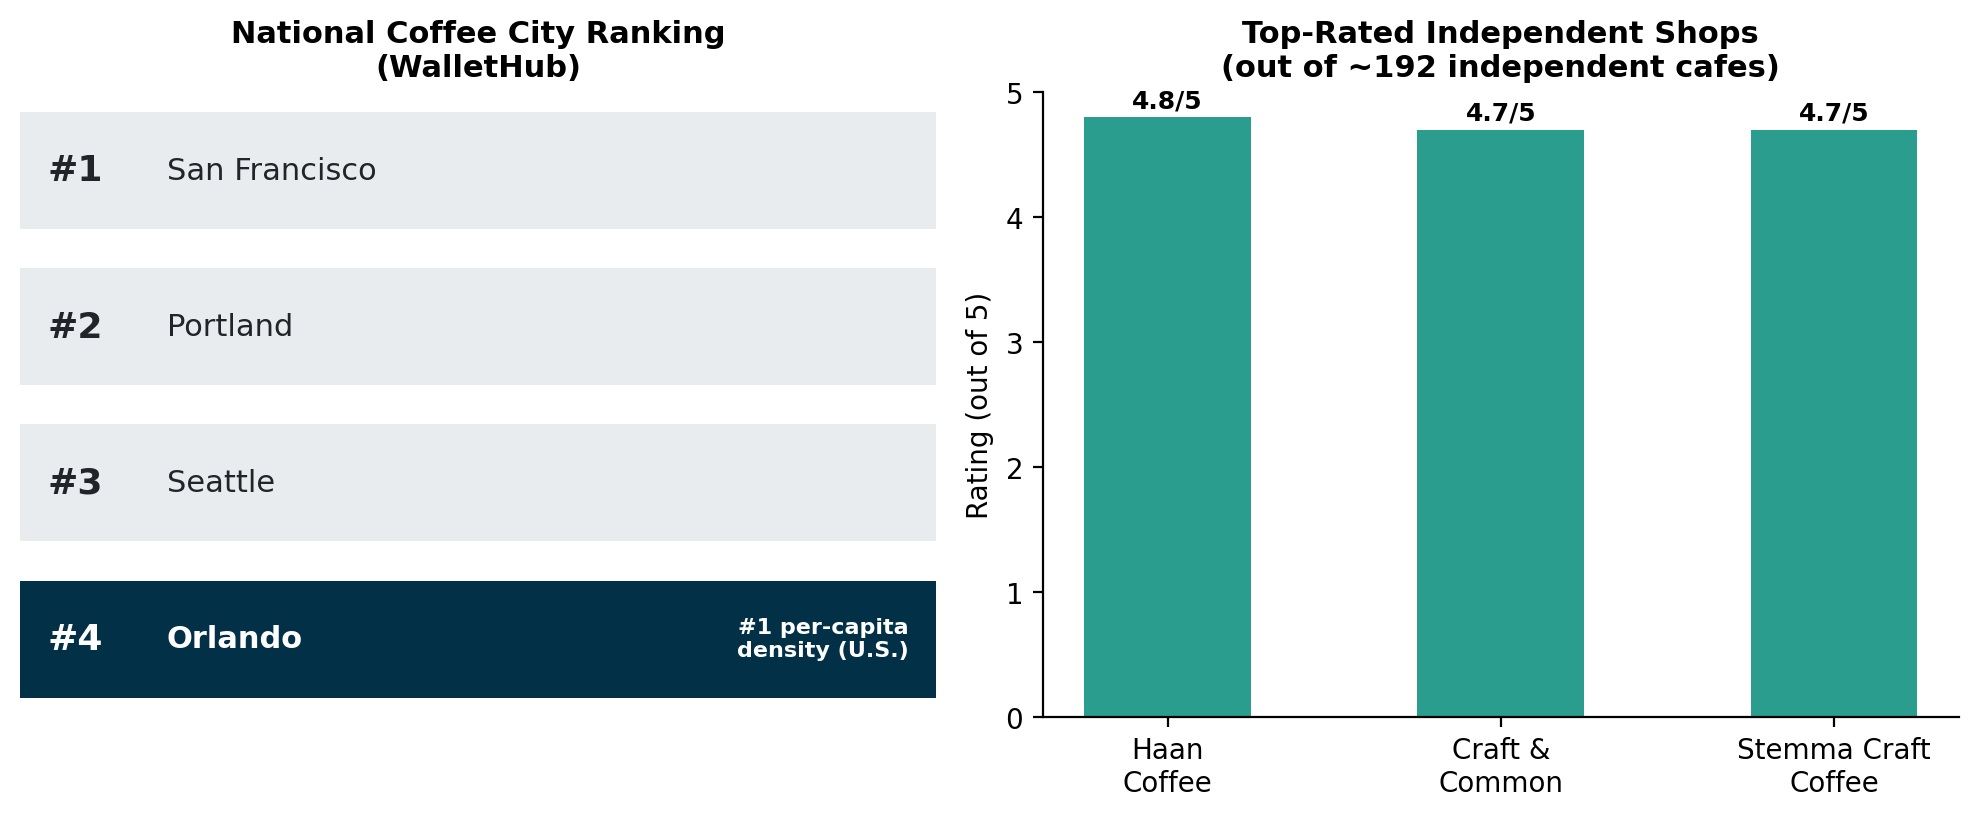
Market Interpretation: With 50 local roasters driving consumer education, Orlando is no longer a dark-roast, commodity-coffee market. Drinkers expect single-origin traceability, precision espresso extraction, and specialty milk alternatives. High beverage quality is no longer a competitive moat—it is simply the baseline price of entry.
3. Micro-Market Saturation & Demand Friction
Introductory Overview:
While citywide statistics highlight massive population growth, zooming in on specific ZIP codes reveals significant supply-and-demand friction. High density can easily cross the threshold from healthy market activity into localized over-saturation. When physical storefront counts outpace local digital search intent, opening a new location becomes an uphill battle for market share rather than an opportunity to fulfill unmet demand.
ZIP Code 32822 Store Count: Localized data identified 28 active coffee businesses operating within a single ZIP code footprint.
Monthly Search Intent: Generated approximately 1,351 localized digital searches for coffee per month.
Relative Search Deficit: Search interest in ZIP 32822 sat 1.1% below the national average despite heavy storefront concentration.
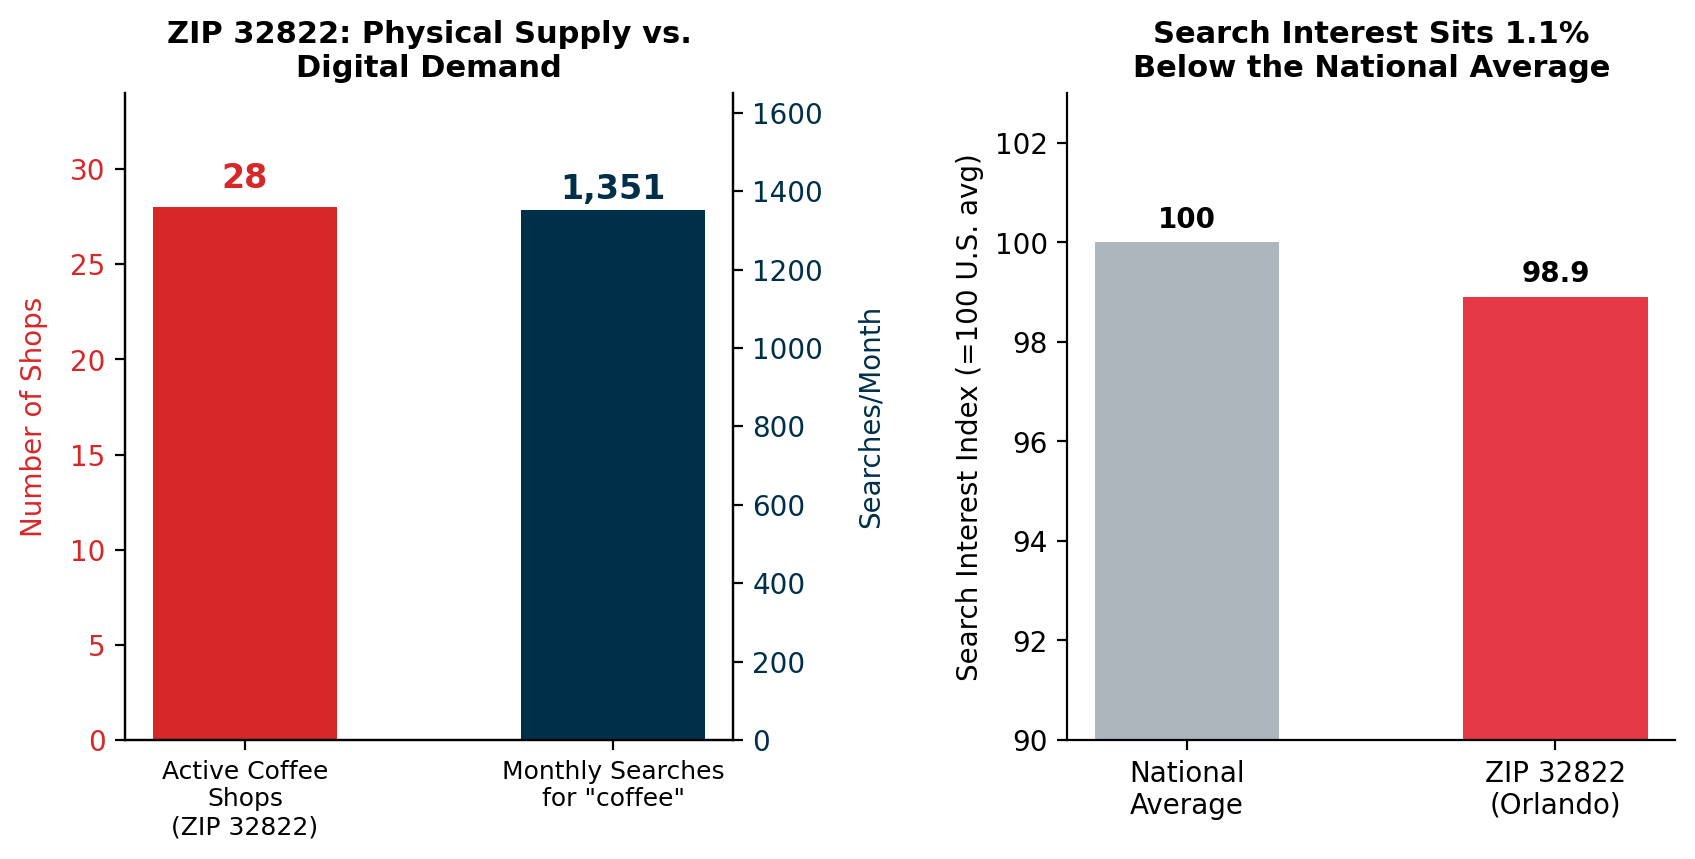
Market Interpretation: This localized snapshot serves as a stark warning against blind footprint expansion. High storefront counts prove historical interest, but opening a standard, non-differentiated café in a ZIP code already holding 28 competing doors simply fragments existing foot traffic. When digital search intent remains flat, adding more physical doors dilutes revenue across competitors rather than expanding total market demand.
4. Financial Sensitivity & Unit Economics
Introductory Overview:
Given the high commercial rents and rising labor costs across Central Florida, store-level profitability cannot rely solely on transaction volume. Modern unit economics are overwhelmingly dictated by Average Order Value (AOV). By shifting guest behavior through bundled food items, retail bean sales, or specialty signature drinks, operators can significantly increase gross top-line revenue without straining operational throughput.
Baseline Model ($6.00 Ticket / 250 Daily Transactions): Generates $1,500 daily revenue ($547,500 gross annual revenue).
Mid-Tier Model ($7.00 Ticket / 250 Daily Transactions): Generates $1,750 daily revenue ($638,750 gross annual revenue).
Optimized Ticket Model ($9.00 Ticket / 250 Daily Transactions): Generates $2,250 daily revenue ($821,250 annual revenue)—capturing $273,750 in additional top-line revenue without adding a single extra customer.
Medium-Volume Model ($7.00 Ticket / 350 Daily Transactions): Generates $2,450 daily revenue ($894,250 gross annual revenue).
High-Velocity Model ($7.00 Ticket / 500 Daily Transactions): Generates $3,500 daily revenue ($1,277,500 gross annual revenue).
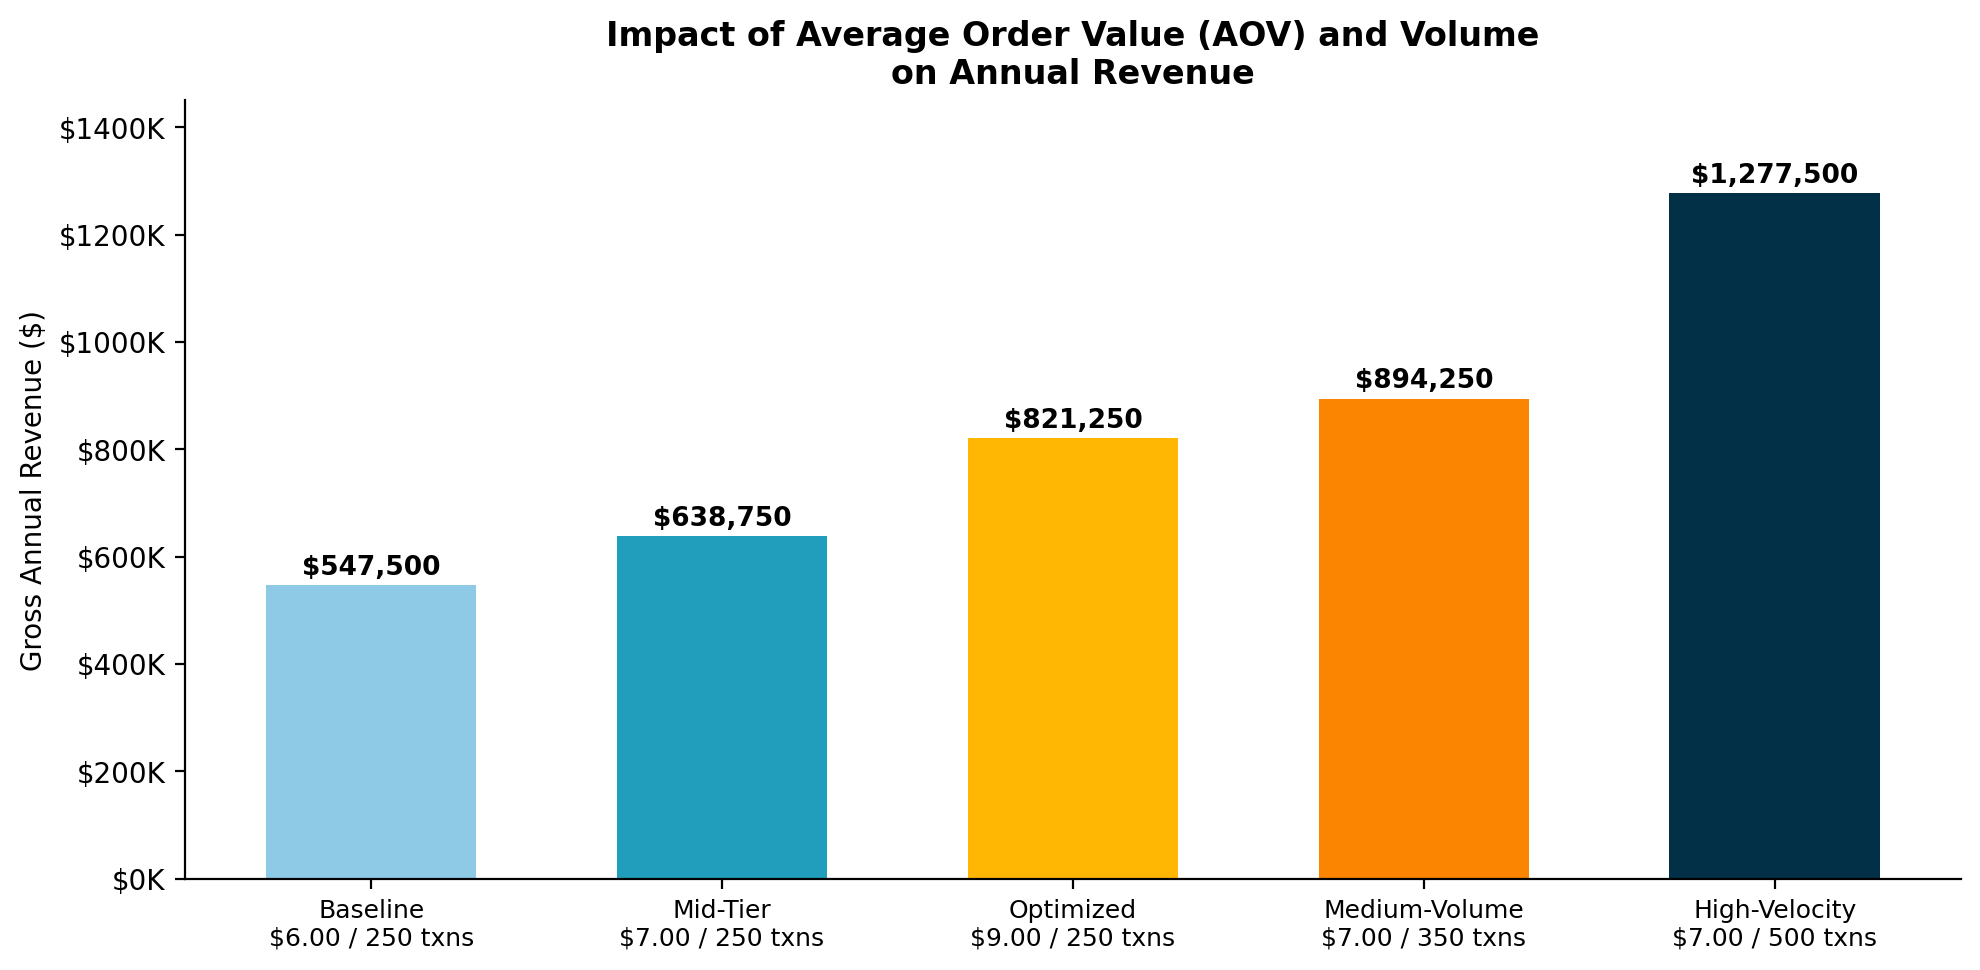
Market Interpretation: In an era of elevated labor costs and rising commercial rents, relying solely on $4.00 black coffee is a recipe for margin compression. The financial math clearly demonstrates that expanding top-line revenue hinges on Average Order Value (AOV). Upselling guests on high-margin food items or retail beans transforms store economics far more efficiently than chasing incremental foot traffic.
5. Strategic Execution Scenarios
Introductory Overview:
To visualize how these financial variables play out on the ground, we evaluate three practical business formats operating within Orlando’s current density footprint. Each model balances rent exposure, speed of service, and food attachment differently, illustrating why tailored operational execution is mandatory for survival in high-density corridors.
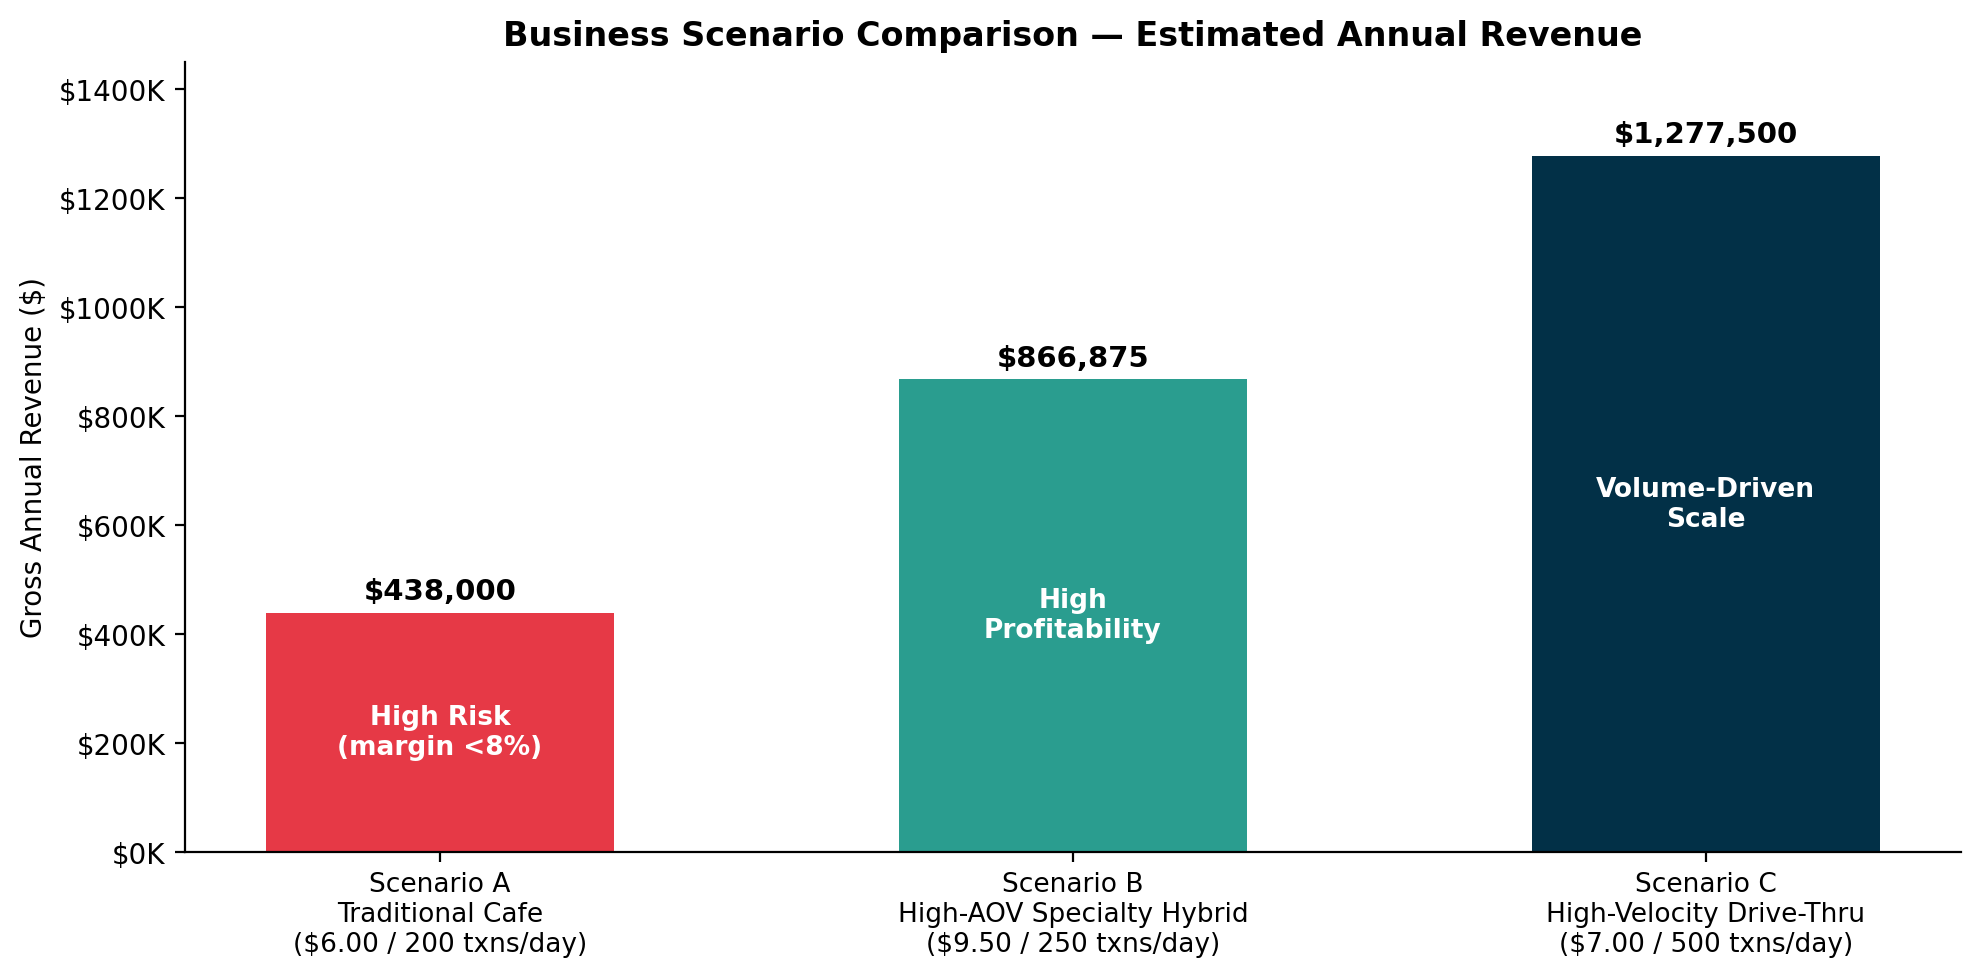
Scenario A: The Traditional Neighborhood Café (High Risk)
Operational Profile: Standard 1,200 sq ft footprint serving traditional coffee drinks and basic pastries in a crowded residential pocket.
Financial Metrics: 200 daily transactions at a $6.00 average ticket ($438,000 annual revenue).
Strategic Verdict: Highly vulnerable. Low transaction counts combined with weak food attachment rates yield thin operating margins (<8%), leaving the business exposed to lease renewals and supply chain inflation.
Scenario B: The High-AOV Specialty Hybrid (High Profitability)
Operational Profile: Specialty espresso bar paired with an artisanal food program or lifestyle studio space (e.g., Qreate model).
Financial Metrics: 250 daily transactions at a $9.50 average ticket ($866,875 annual revenue).
Strategic Verdict: Extremely resilient. Pushing average tickets near $10.00 maximizes profit per square foot, insulating the store against volume swings without needing extreme daily throughput.
Scenario C: High-Velocity Commuter Drive-Thru (Volume Scale)
Operational Profile: Double drive-thru or rapid mobile pick-up hub located along heavy commuter corridors like SoDo.
Financial Metrics: 500 daily transactions at a $7.00 average ticket ($1,277,500 annual revenue).
Strategic Verdict: Capitalizes on morning rush velocity. High transaction speed offsets minimal customer dwell time, delivering strong cash flow through labor-optimized workflows.
6. Core Strategic Conclusions
Introductory Overview:
Synthesizing Orlando’s macro demographics, market density metrics, and unit economics yields clear strategic imperatives for developers, investors, and independent owners. Success in this market demands a disciplined approach to site selection, rigorous ticket optimization, and a clear understanding of customer retention mechanics.
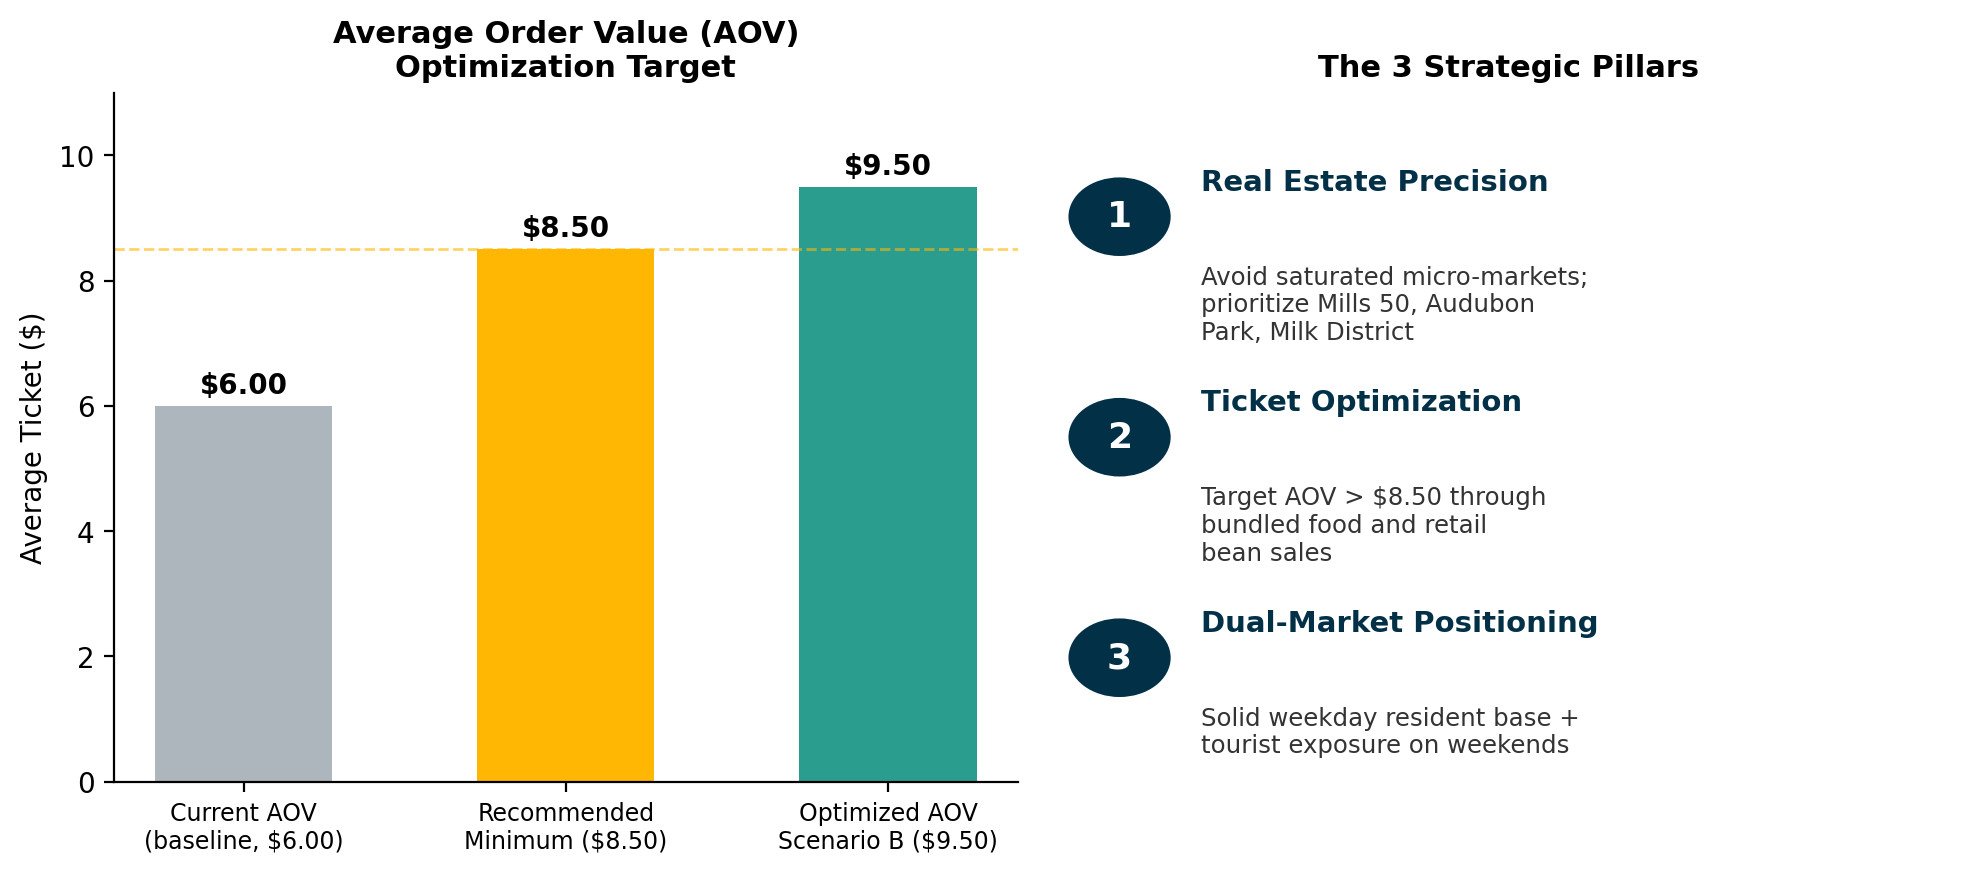
Real Estate Precision Over Blanket Expansion: Avoid over-saturated micro-markets unless introducing a unique access model like drive-thru speed. Prioritize emerging residential hubs such as Mills 50, Audubon Park, or the Milk District.
Mandatory Ticket Optimization: Current operating expenses require targeting an average order value above $8.50. Bundling specialty food, retail bean bags, or signature drinks is essential to maintaining healthy net margins.
Dual-Market Positioning: The most sustainable enterprises build a loyal residential regular base for weekday stability while maintaining proximity to major corridors to capture high-margin tourist spend on weekends.
Orlando’s transformation into a premier coffee metropolis proves that population growth and consumer sophistication can turn a regional market into a powerhouse. However, because per-capita café density sits at record highs, the primary business risk is no longer consumer scarcity—it is market saturation. Achieving long-term profitability requires precise site selection, relentless menu upselling, and a sharp operational identity that gives Central Florida coffee drinkers a compelling reason to make your shop their daily ritual.
Listings related to Demographic Dynamics, Density Thresholds, and Unit Economics: A Market Study on Orlando’s Specialty Coffee Ecosystem

Deeply Coffee Co.
Haan Coffee
Lineage Coffee Roasting

Qreate Coffee + Studio
Stemma Craft Coffee
Craft & Common