The Tourist Liquidity Engine: How 76.7 Million Visitors Fuel Orlando’s Retail Coffee Arbitrage
While permanent residential growth creates the essential Monday-through-Thursday baseline for Central Florida operators, transient tourism represents the high-volume liquidity engine that elevates Orlando above standard metropolitan coffee markets. In 2025, Orlando welcomed tens of millions of visitors who entered the commercial ecosystem with elevated discretionary budgets, relaxed spending habits, and high daily purchase frequencies. For coffee operators, this influx presents a rare micro-economic opportunity: capturing low-friction, high-margin transactions from a constantly rotating consumer base that considers specialty caffeine an integral part of their daily travel experience.
1. Tourist Volume & Macro Mobility Infrastructure
Introductory Overview:
To calculate the total addressable transient market (TAM) for Orlando coffee storefronts, operators must look beyond aggregate headcounts and evaluate visitor origin, duration of stay, and mobility corridors. Different traveler segments exhibit vastly different purchasing patterns, ranging from high-velocity drive-thru runs at commercial kiosks like Scooter's Coffee or 7 Brew along major traffic arteries, to extended sit-down café visits at destination concepts like Foxtail Coffee Co. within high-footprint leisure corridors.
Record Tourist Influx: Reached an all-time historic record of 76,663,200 total visitors in 2025, representing a 1.8% year-over-year expansion.
Domestic Travel Baseline: Driven by 70.33 million domestic visitors, creating a reliable year-round flow of nationwide travel traffic.
High-Expenditure International Market: Complemented by 6.34 million overseas visitors who traditionally log longer stays and higher per-capita beverage spending.
Domestic Leisure Core: Anchored by 62.40 million leisure travelers, forming the primary demographic visiting theme parks, shopping districts, and resort corridors.
Overnight Domestic Volume: Accounted for 49.2 million domestic overnight visitors, generating persistent demand for morning coffee away from home.
Business & Convention Traffic: Fueled by 5.8 million convention and group travelers, driving concentrated morning rush periods around business hubs.
Airport Transit Engine: Supported by 57,669,226 passengers passing through Orlando International Airport (MCO), sustaining high-velocity airport concession sales.
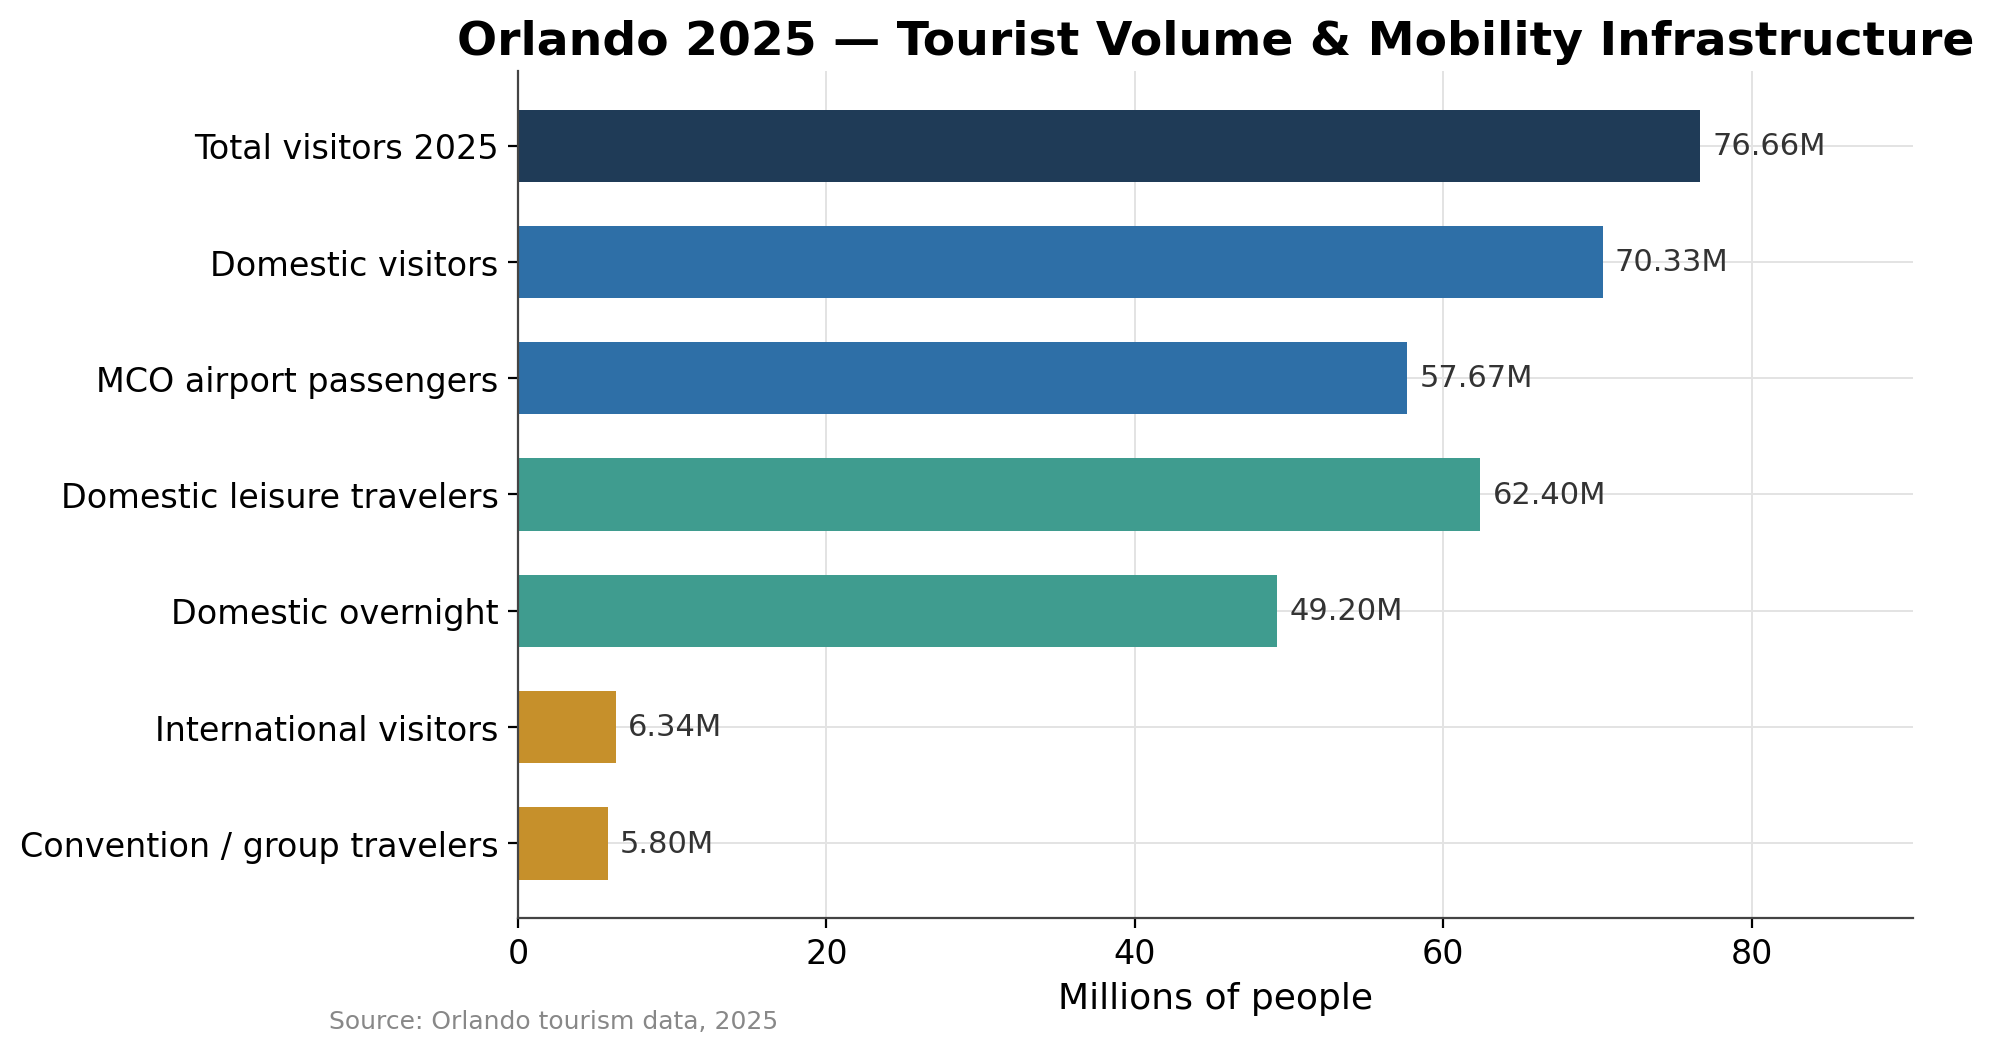
Market Interpretation: The massive transit volume passing through MCO and major highway corridors creates distinct spatial clusters for coffee demand. While domestic leisure travelers drive volume around attraction zones, business convention attendees concentrate demand in tight morning windows around the Orange County Convention Center, allowing specialized operators to capture high throughput in short operational timeframes.
2. The Micro-Economics of Tourist Arbitrage & Low-Friction Spending
Introductory Overview:
The financial advantage of serving tourist traffic lies in psychological pricing dynamics. Unlike local regulars who measure a $7.00 beverage against their monthly budget, vacationing consumers operate with relaxed price sensitivity. Regional operators like CFS Coffee (Colombian Specialty Coffee) leverage this by pairing specialty espresso with expanded Latin-inspired food menus, significantly elevating Average Order Value (AOV) compared to traditional beverage-only counters.
Domestic Leisure Budget: Domestic leisure visitors recorded an average spend of $1,047 per person per trip, with an average stay of 2.9 nights.
International Spending Power: Overseas travelers (excluding Canada) registered an average spend of $1,123 per person per trip, staying an average of 8.5 nights.
Family Group Composition: Approximately 51% of overseas visitor groups included children, expanding the average order size to cover non-coffee beverages and food items.
Price Inelasticity: Within a $1,000+ travel budget, an $8.00 specialty drink represents a negligible micro-transaction with minimal consumer resistance.
High Purchase Frequency: Unlike single-event vacation activities, caffeine consumption recurs daily and often spikes again during afternoon energy slumps.
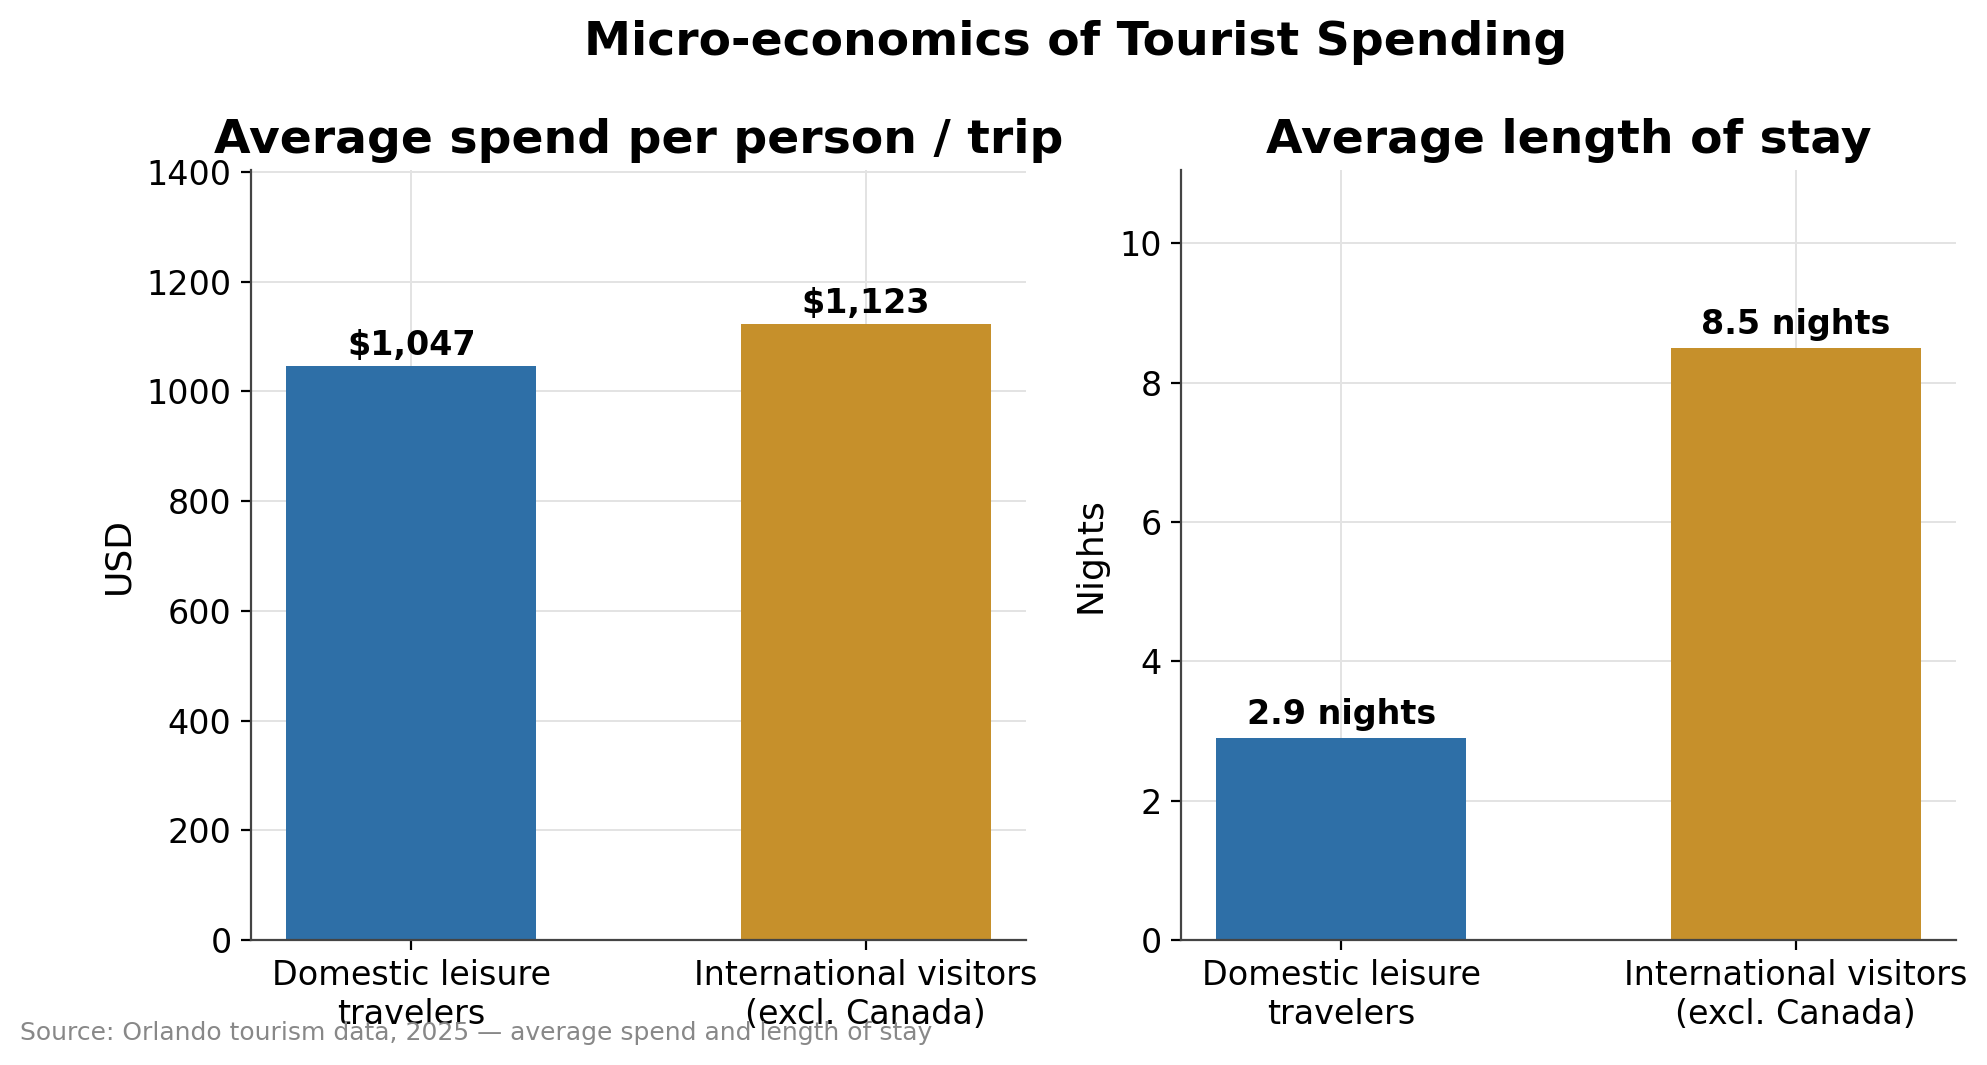
Market Interpretation: Tourist consumers exhibit minimal price sensitivity when purchasing morning daily essentials. While a family might deliberate over a multi-hundred-dollar park ticket, adding pastries, bottled beverages, or signature cold brews to a morning coffee run occurs with virtually zero friction, allowing shops in tourist zones to maintain significantly higher average order values.
3. Spatial Distribution & Tourist Touchpoints
Introductory Overview:
Tourist movement across Central Florida follows predictable physical corridors. Operators who map store placement against these transit channels can capture multiple purchase occasions per traveler. This spatial dynamic creates room for both high-velocity drive-thru kiosks on commuter routes and dedicated walk-in neighborhood destinations, such as Easy Luck Coffee & Bodega in the Milk District or Framework Craft Coffee House in Mills 50, which capture adventurous tourists seeking authentic sit-down community culture away from commercial tourist strips.
Pre-Park Commute Zones: High-speed drive-thru hubs along major thoroughfares (I-4, International Drive, US-192) capture morning traffic heading toward theme parks.
Leisure & Retail Districts: Walk-in lifestyle concepts in areas like Winter Park, Downtown Orlando, or Disney Springs capture mid-day retail foot traffic.
Convention & Hospitality Nodes: Rapid-service espresso bars within or adjacent to major convention hotels cater to remote-working professionals and conference attendees.
Resort & Vacation Rental Clusters: Walk-in neighborhood spots near major resort hubs or dense Airbnb corridors capture long-stay international families seeking authentic local coffee experiences.
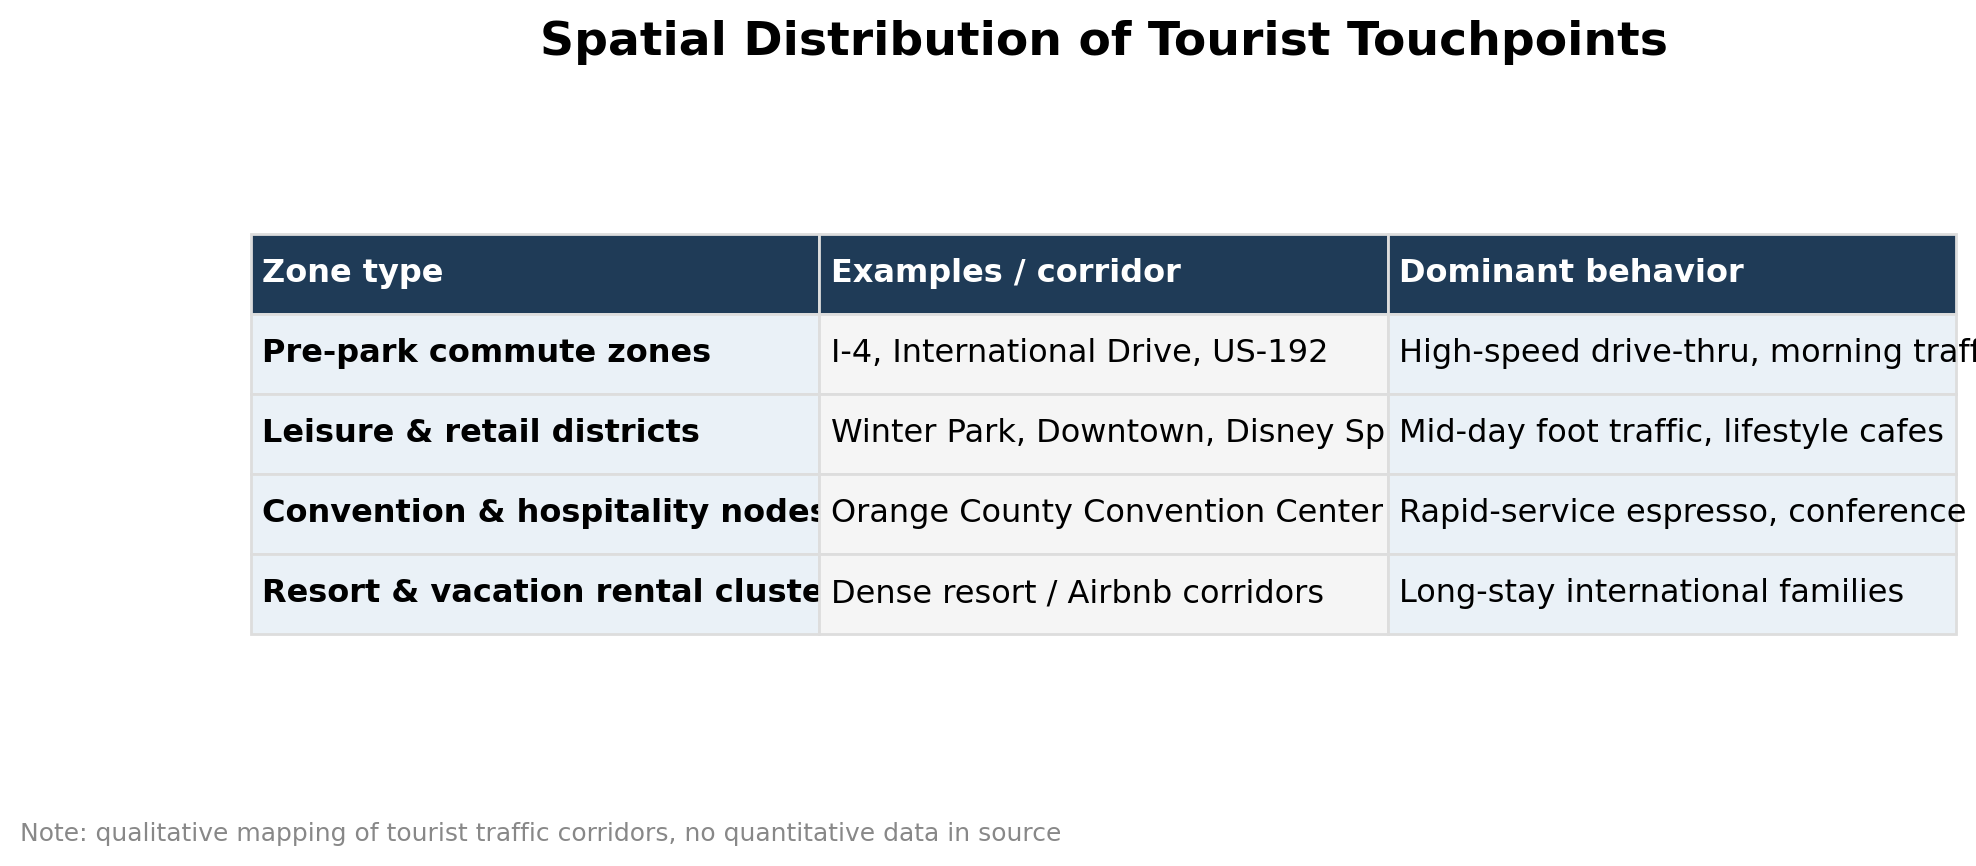
Market Interpretation: Real estate selection for walk-in specialty concepts requires aligning store placement with foot-traffic mobility rather than vehicle counts. While high-density retail districts capture relaxed afternoon shoppers, positioning near convention centers or dense rental corridors captures high-velocity morning rush demand from travelers on foot.
4. Unit Economics & Financial Scenarios in Tourist-Dense Corridors
Introductory Overview:
To illustrate how transient consumer behavior influences financial performance, we model two distinct operational scenarios. We contrast high-volume, quick-serve drive-thru models against hyper-focused niche concepts such as Fable Coffee in East Orlando, which uses a strong community identity to maintain high margins despite an off-strip physical footprint.
Scenario A: Commercial High-Velocity Commuter Hub (Scooter's Coffee / 7 Brew Format)
Operational Profile: Double-lane drive-thru or quick kiosk situated along a major corridor leading toward theme park hubs or dense commuter routes.
Financial Metrics: 450 daily transactions at an average ticket of $7.50 (high-volume flavored beverages + quick baked goods).
Annual Revenue: $3,375 daily / $1,231,875 gross annual revenue.
Strategic Impact: Extreme throughput offsets zero customer dwell time, capitalizing on morning tourist and commuter rush velocity.
Scenario B: Neighborhood Specialty Hybrid (Easy Luck / Framework Format)
Operational Profile: Sit-down specialty café paired with curated bodega goods or community programming, attracting both locals and curious travelers.
Financial Metrics: 220 daily transactions at an average ticket of $11.50 (specialty coffee + artisanal food items + retail beans).
Annual Revenue: $2,530 daily / $923,450 gross annual revenue.
Strategic Impact: High food attachment and retail upselling maximize profit per square foot without requiring extreme transaction velocity.
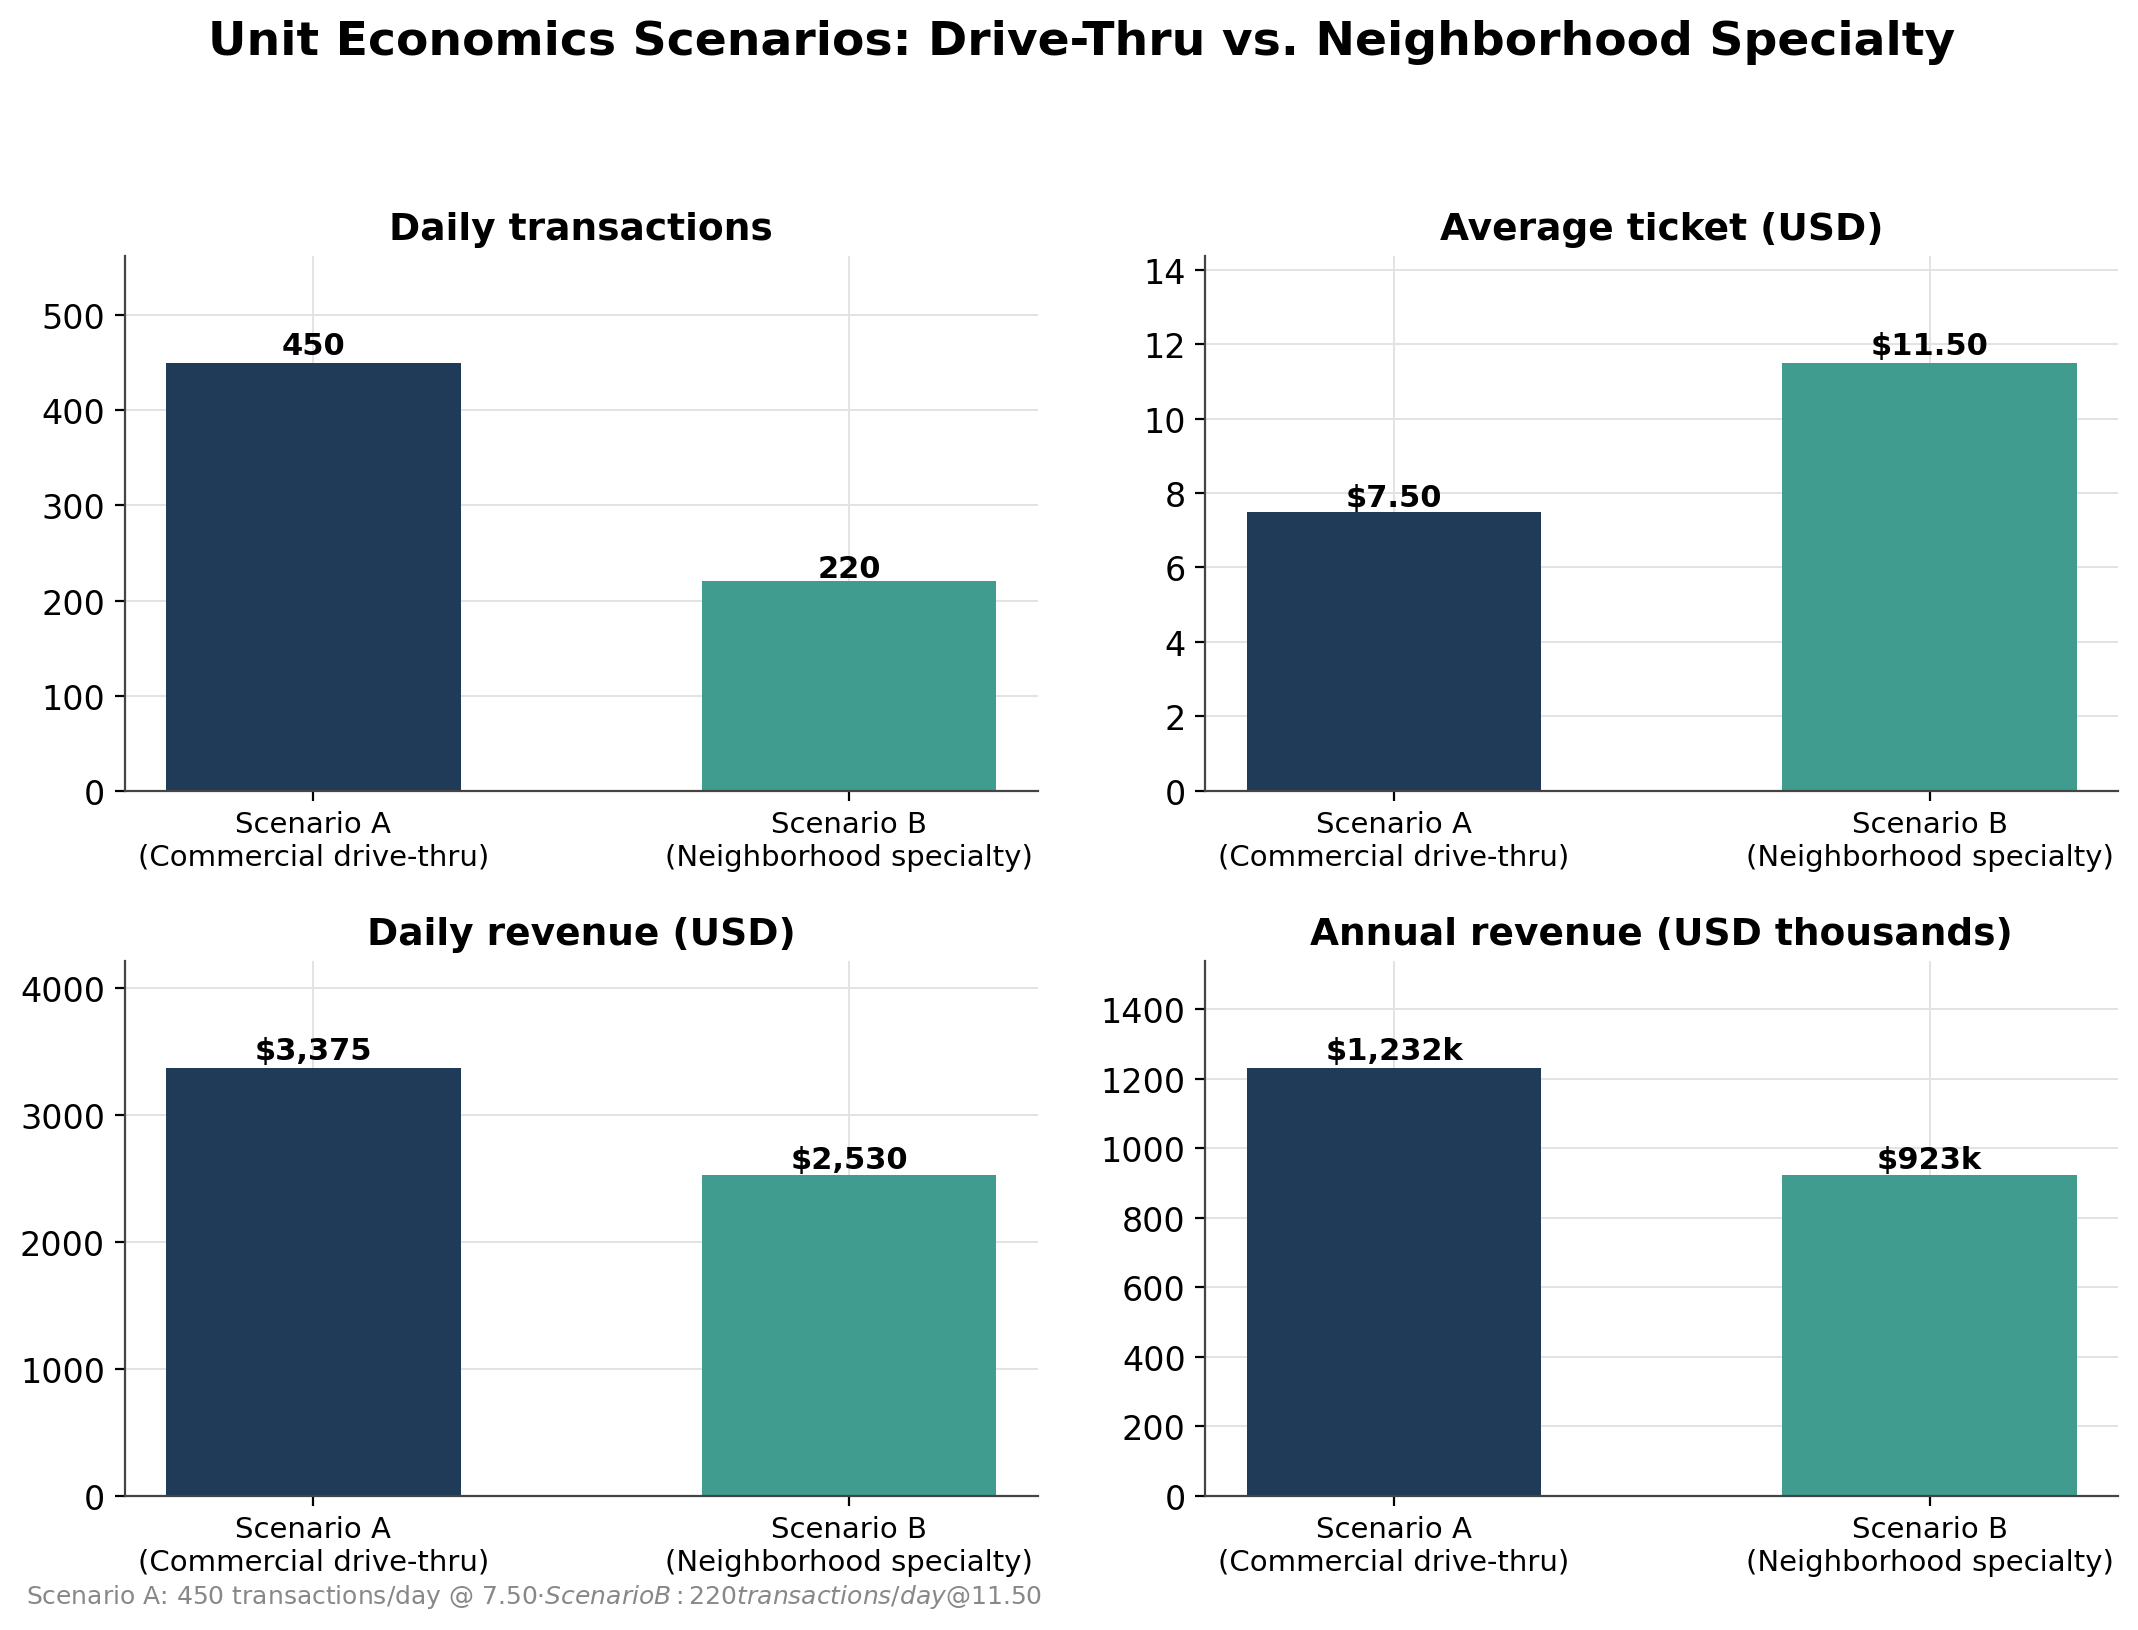
Market Interpretation: Both operational models demonstrate how strategic ticket structuring elevates unit economics above standard baselines. Higher ticket averages allow operators to sustain strong profit margins even when absorbing premium commercial lease rates in competitive corridors.
5. Operational Challenges & Risk Mitigation
Introductory Overview:
Relying exclusively on tourism cash flow introduces structural vulnerabilities. While aggressive chains like Foxtail Coffee Co. can leverage corporate scale to absorb seasonal dips across dozens of stores, independent operators must build explicit hedges against travel seasonality, rising commercial rents, and shifting consumer preferences.
Seasonal Travel Volatility: Tourist volume fluctuates according to school calendars, holiday periods, and weather patterns.
Macro-Economic Risks: International exchange rate fluctuations and airfare pricing can alter overseas travel volume.
High Commercial Real Estate Costs: Prime retail space near tourist hubs commands top-tier rent per square foot, narrowing net operating margins during slow travel months.
Customer Retention Limits: Transient consumers rarely convert into long-term lifetime value (LTV) once their trip concludes, requiring continuous marketing spend or prime physical positioning.
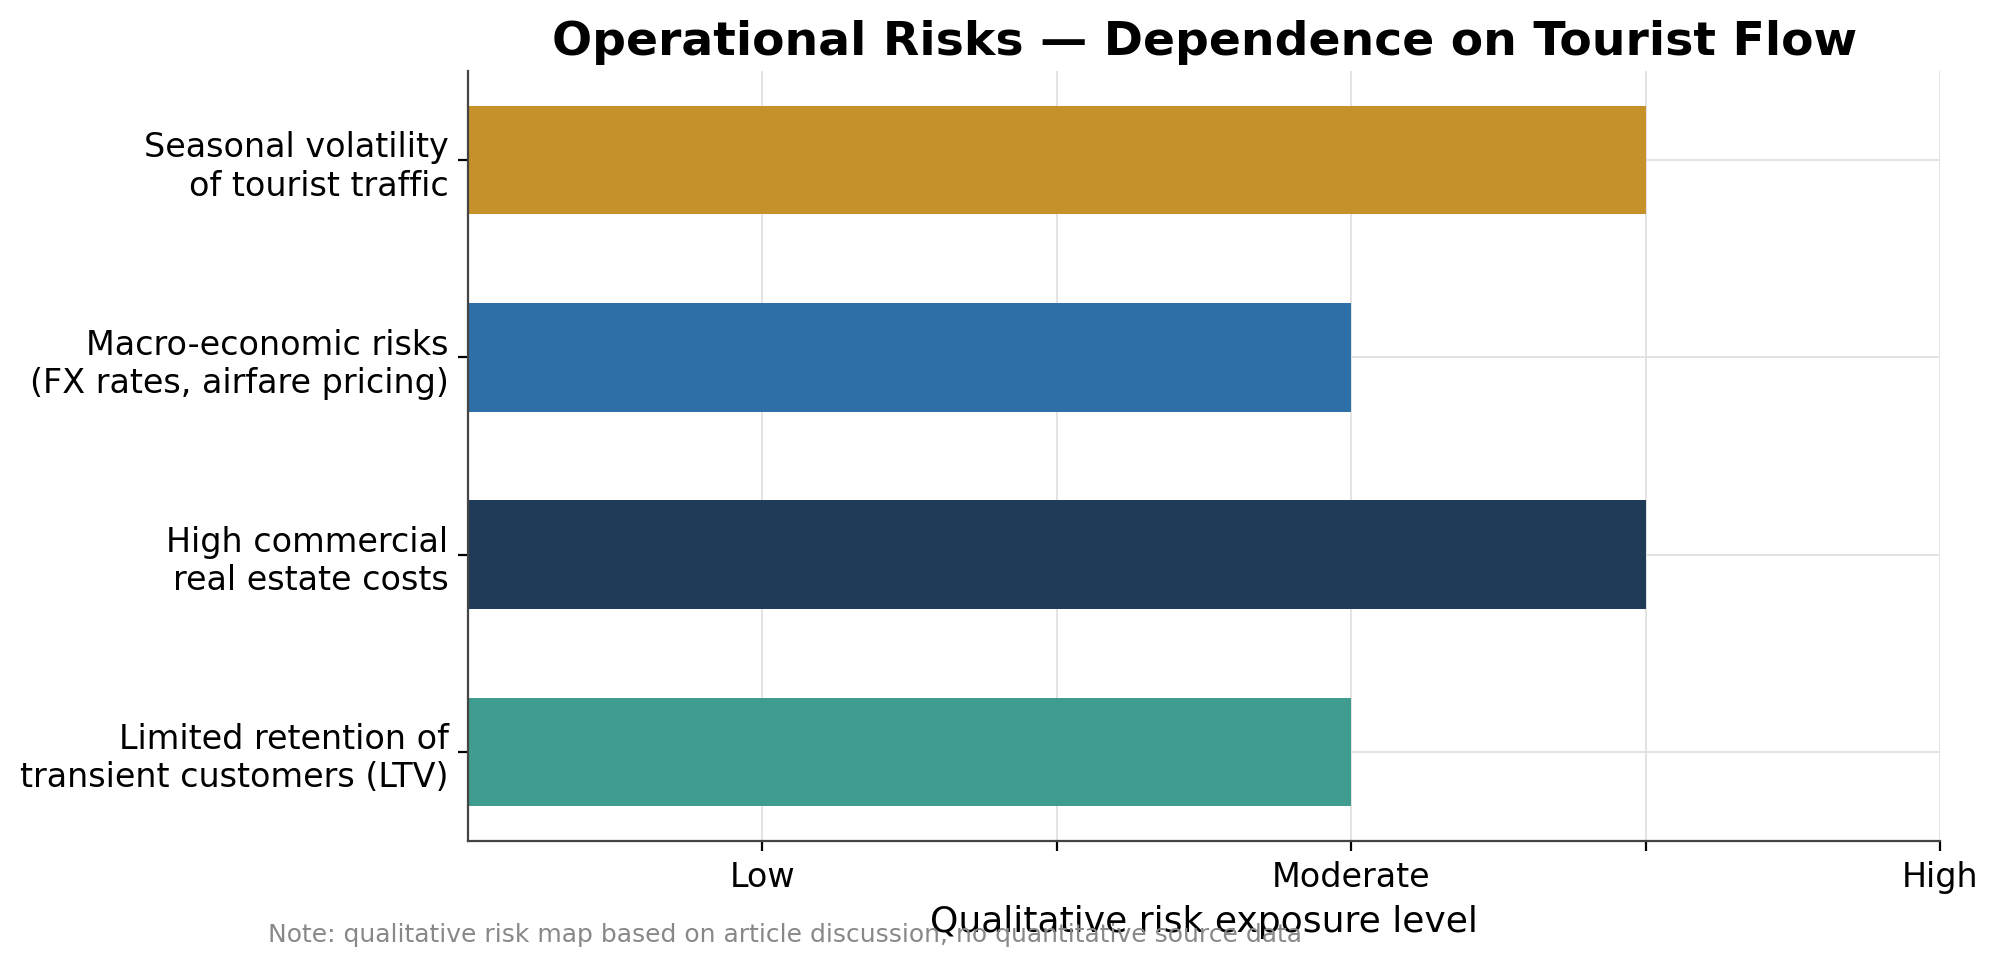
Market Interpretation: A 100% tourist-dependent location faces severe cash flow compression during shoulder travel seasons. To hedge against this volatility, successful brands maintain strict cost controls and avoid over-leveraging on lease rates in pure tourist enclaves without seasonal reserves.
6. Core Strategic Conclusions: The Dual-Market Hybrid Model
Introductory Overview: Synthesizing Orlando’s massive 76.66 million visitor footprint with retail beverage economics points to one clear winning framework: the dual-market hybrid coffee storefront.
The Dual-Market Advantage: Position storefronts along boundaries that blend dense residential neighborhoods with primary tourist corridors (e.g., Mills 50, Winter Park, SoDo).
Weekday Stability: Rely on local regular traffic from Monday through Thursday to cover fixed rent and baseline operational costs.
Weekend Arbitrage: Capture high-margin, price-inelastic tourist spending on weekends and peak holiday travel periods to maximize net profitability.
Menu Bundling Strategy: Structure food and beverage menus to encourage bundled purchasing, targeting an average order value above $8.50 across both customer segments.
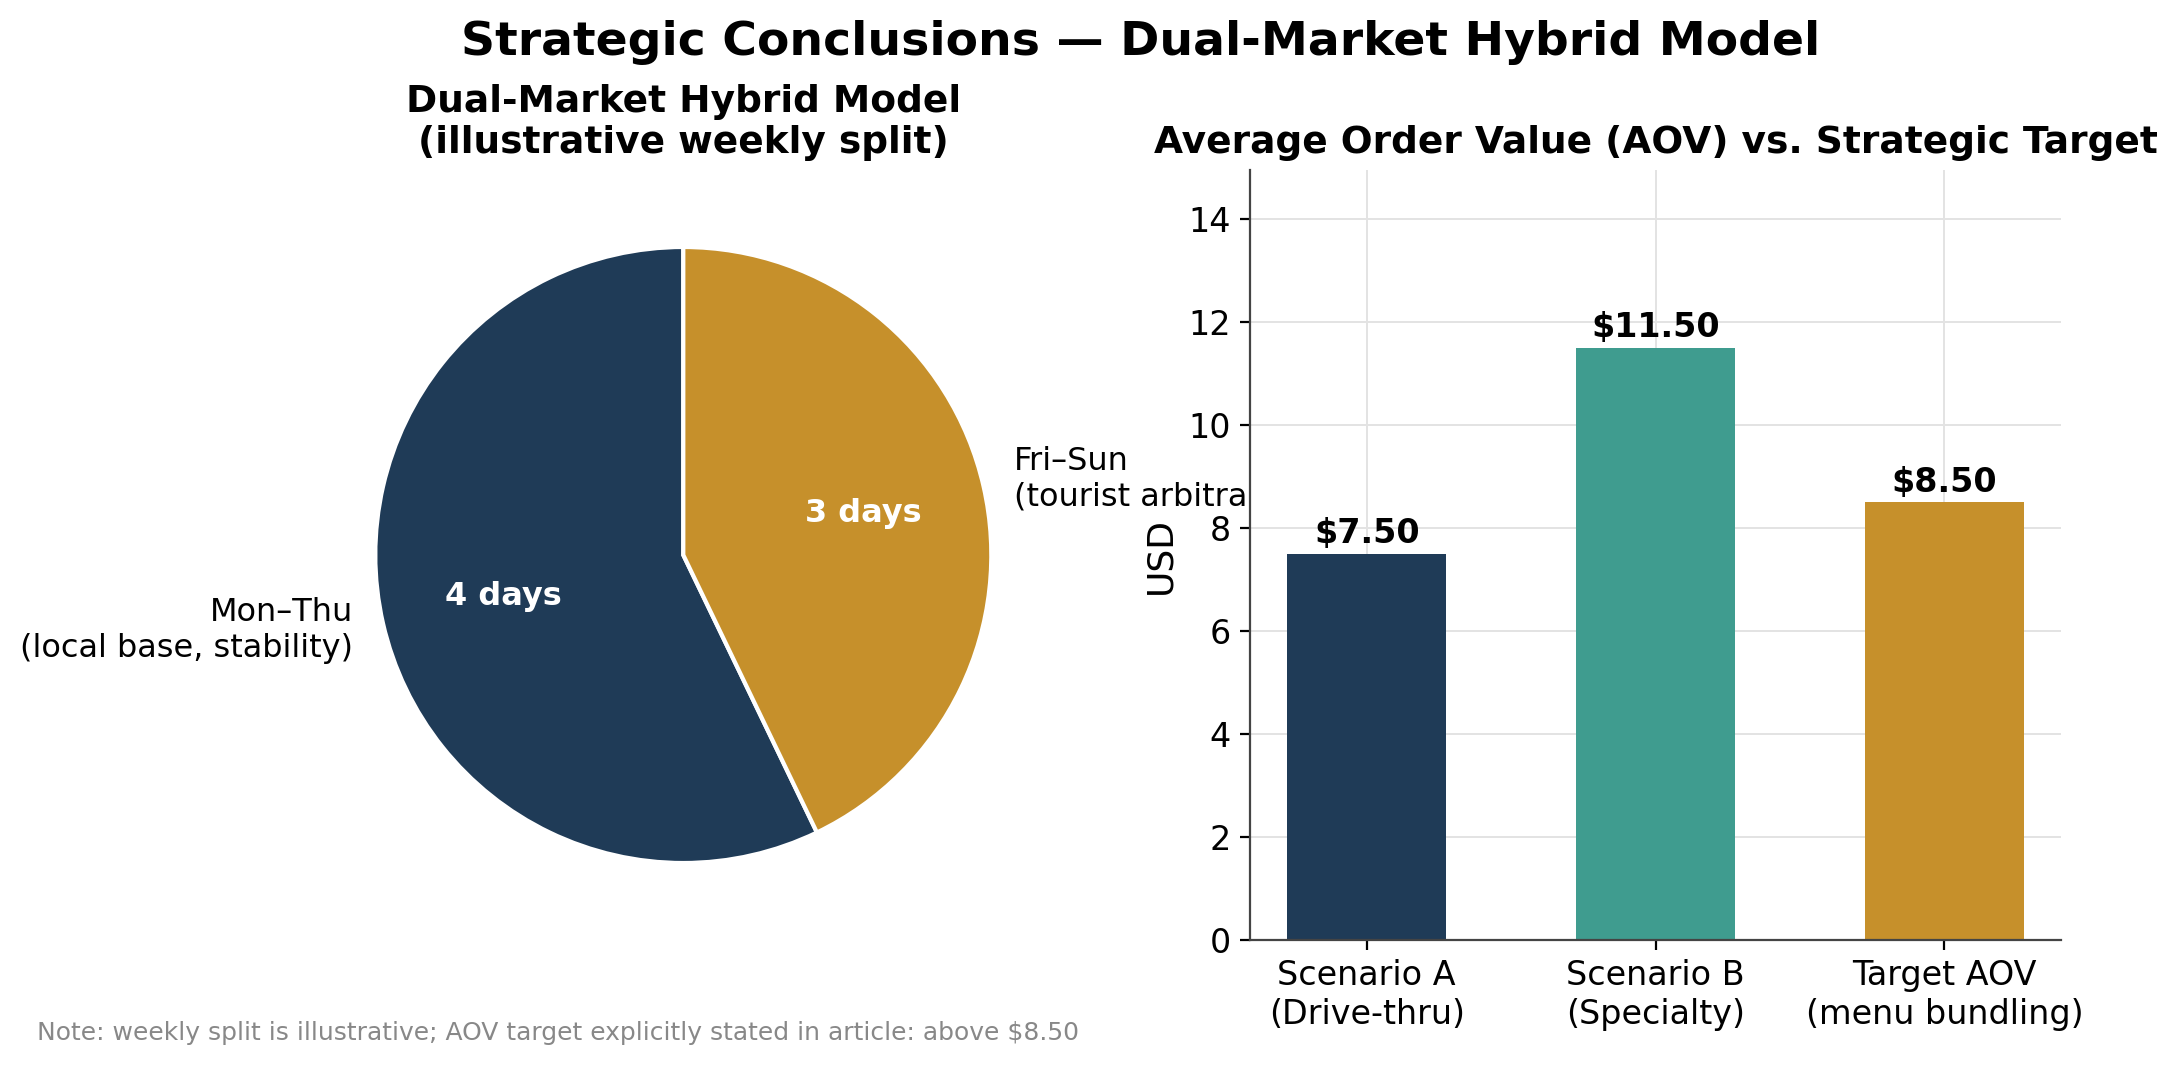
Orlando’s 76.66 million annual visitors inject enormous financial liquidity into the retail coffee ecosystem. Coffee stands out as a low-friction, high-frequency travel expense that visitors make repeatedly throughout their stay. Whether competing as a high-velocity drive-thru operator or building a cult following as a niche specialty gem, operators who master real estate positioning and ticket optimization are primed to capture exceptional returns in America's premier tourism capital.
Listings related to The Tourist Liquidity Engine: How 76.7 Million Visitors Fuel Orlando’s Retail Coffee Arbitrage
7 Brew Coffee

Easy Luck Coffee & Bodega
Fable Coffee & Pastries
Foxtail Coffee Co. (College Park)
Framework Craft Coffee House
Scooter's Coffee